Case study 11 — Social link analytics
LinkTap
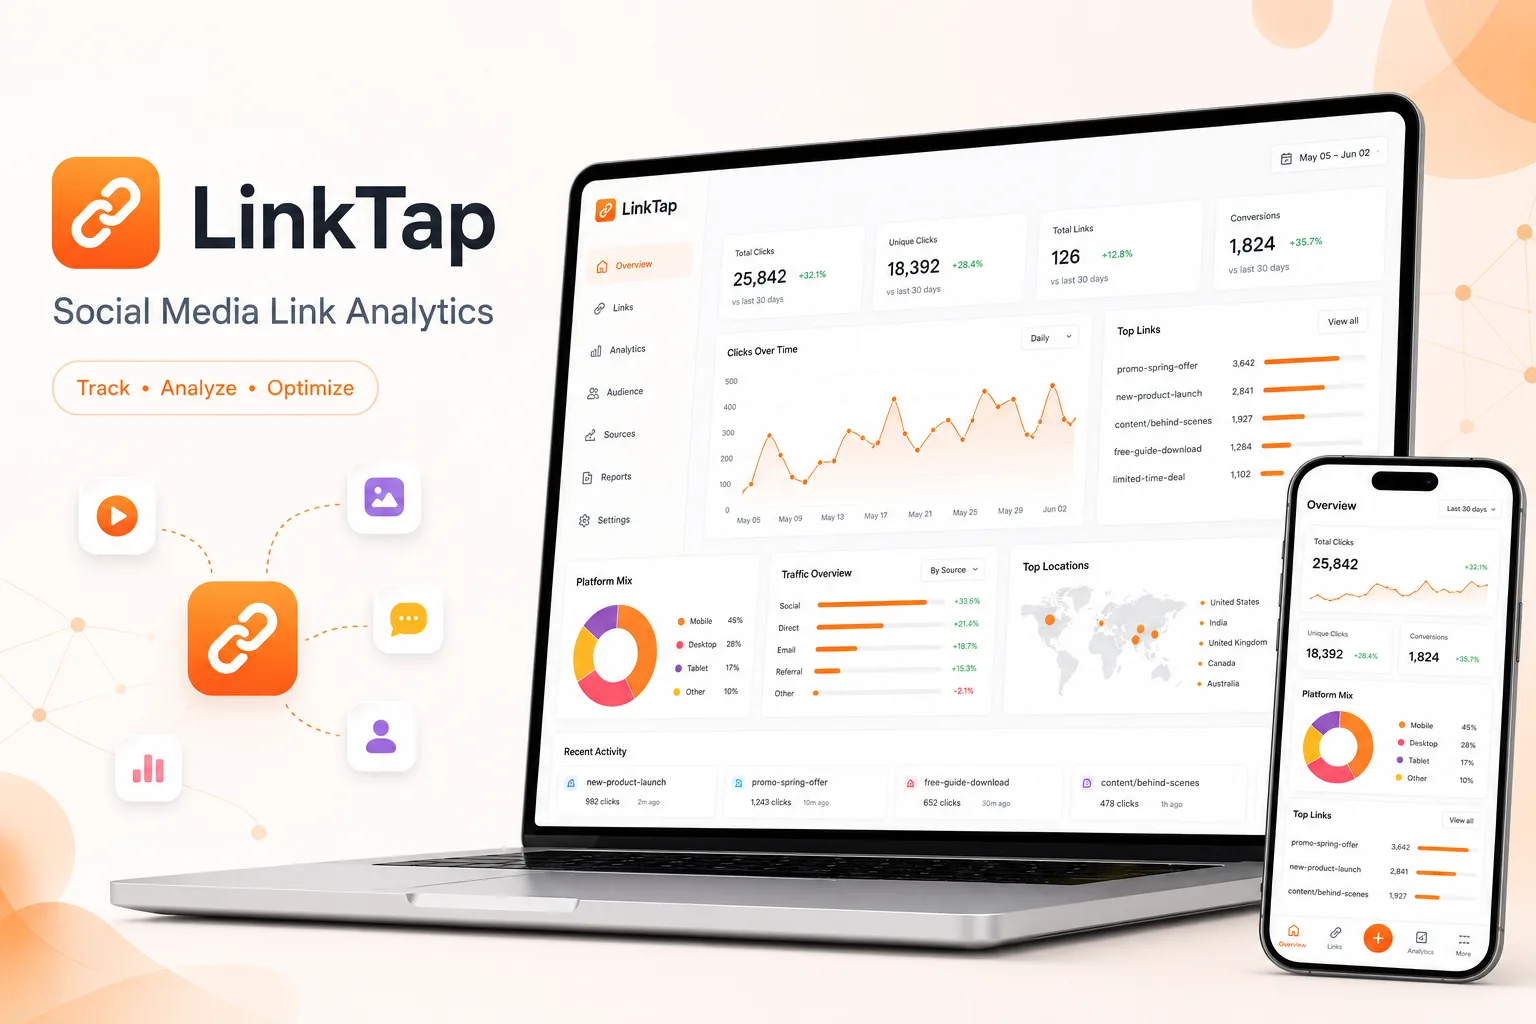
Social platforms tell you what happened on the platform. They stop at the click. LinkTap carries the visitor across that boundary, so a post can be judged by what it actually sent you rather than by how it performed in someone else's dashboard.
- Next.js
- TypeScript
- Firebase
- BigQuery
The problem
Traffic from social accounts arrives as an undifferentiated block. Without per-post attribution there is no way to know which content drove visits, which channels are worth the effort, or what visitors did once they arrived.
What we built
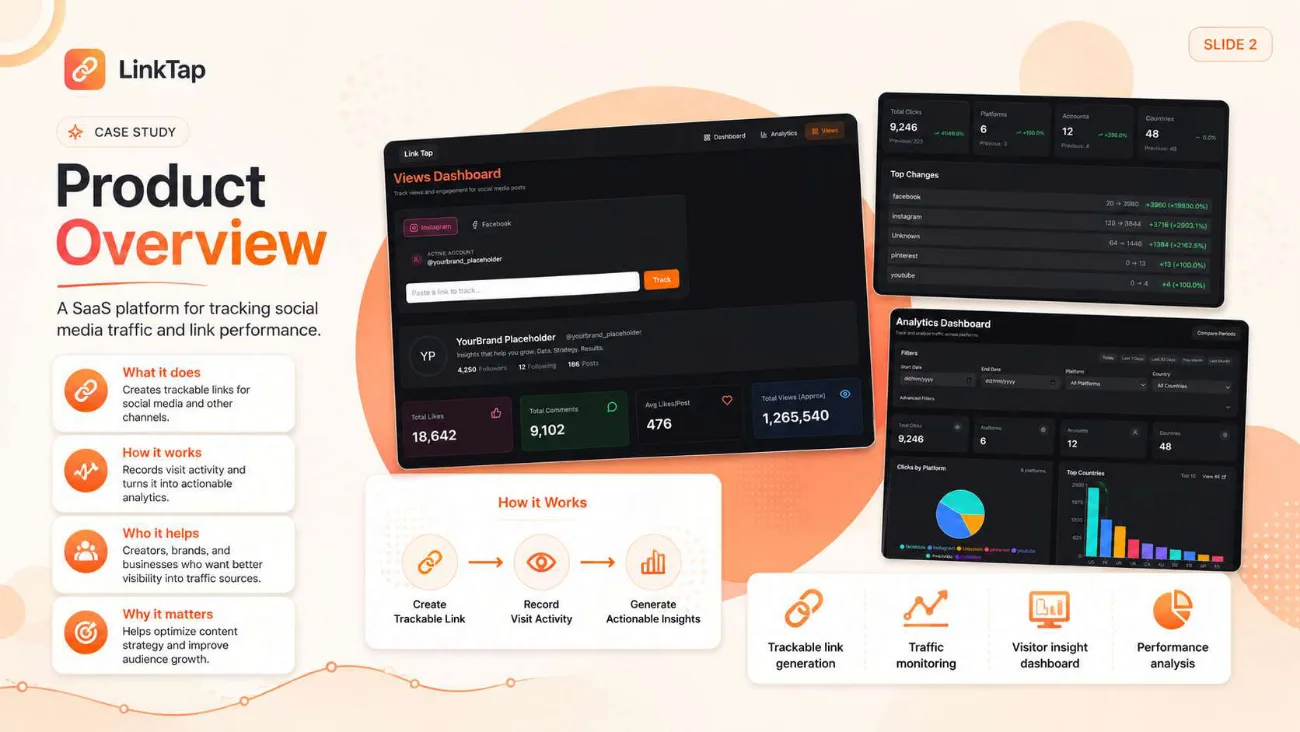
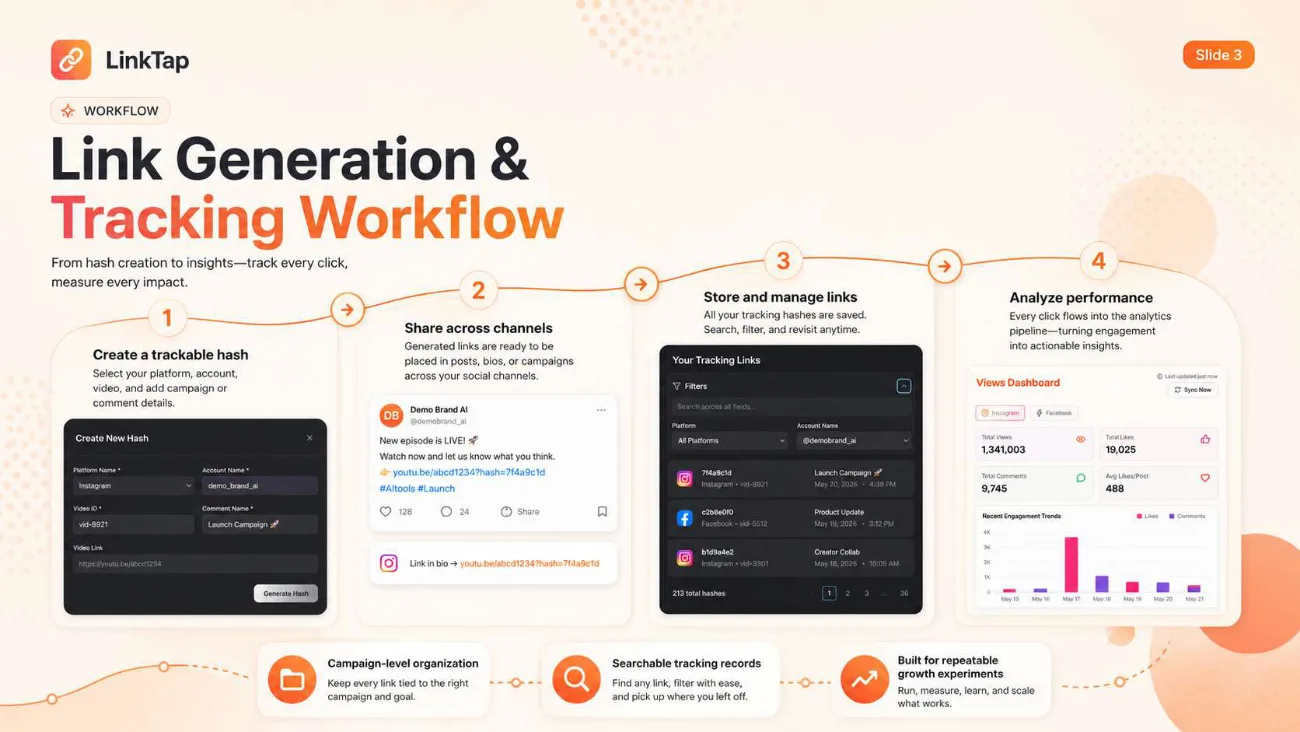
A trackable hash is created per platform, account, video and campaign, shared wherever the post goes, and every click flows into an analytics pipeline. Links are stored, searchable and reusable, so tracking becomes a repeatable growth experiment rather than a one-off.
How it works
A hash per post, not per campaign
Creating a trackable link means naming the platform, the account, the specific video and the campaign, so arriving traffic resolves to a single piece of content rather than to a channel in aggregate.
Links that stay findable
Every generated hash is stored, searchable and filterable by platform and account, so a link created weeks ago can be picked up and continued rather than recreated.
Traffic intelligence across platforms and time
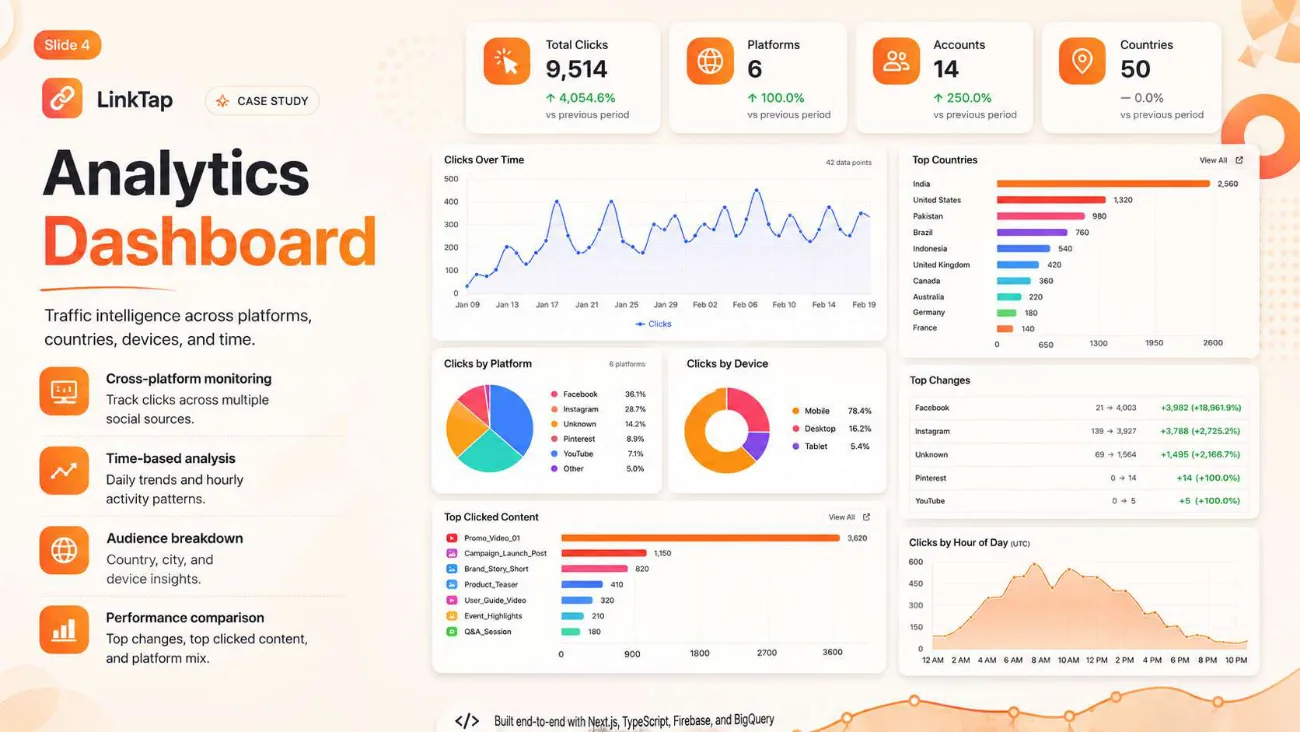
Cross-platform monitoring sits alongside daily trends and clicks-by-hour-of-day, so the question of when to post is answered from the same data as the question of where.
Audience breakdown to city and device
Country, city and device splits show not just how much traffic arrived but what kind, which is what separates a vanity total from something you can plan against.
Engagement insight beside click data
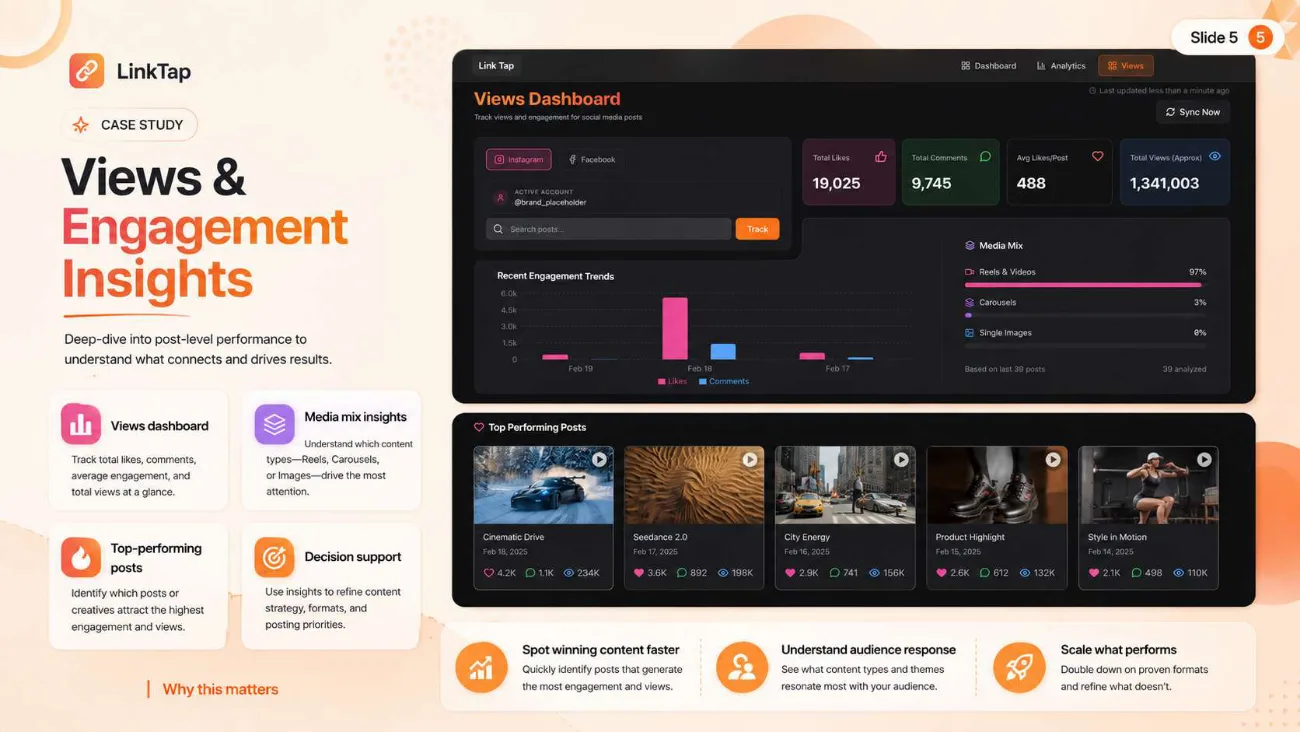
A views dashboard tracks likes, comments, average engagement per post and total views, with a media-mix breakdown showing whether reels, carousels or single images are carrying the account.
Performance comparison built in
Top changes between periods, top clicked content and platform mix are surfaced together, so a shift in performance is visible without exporting anything.
In the product
Outcome
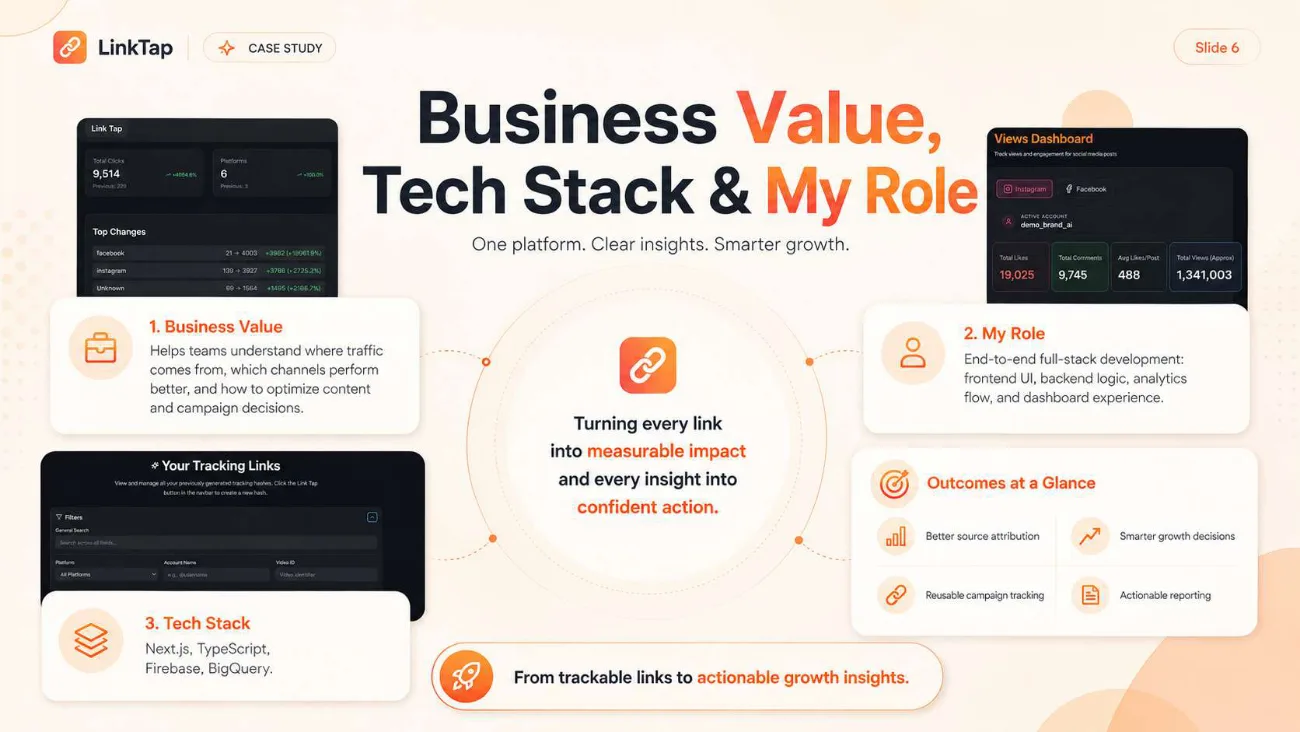
Better source attribution, smarter growth decisions, reusable campaign tracking and reporting that can be acted on, every link turned into measurable impact rather than a click that disappears at the platform boundary.